

— a comparative analysis of spending under two different regimes
Today’s article extends on the theoretical and empirical work which this author has embarked upon a few weeks ago to examine an interesting monetary theme in a third world developing economy context. The central focus in today’s piece highlights the trend and levels of Government spending for the period 1993 – 2019 (26 years), the rate of growth and allocation towards current and capital expenditure over this period. 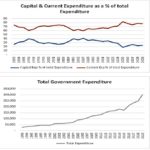
The period under examination covers a total of 26 years of which 21 years were governed by the previous administration and the latter five years are governed by the current administration. In 26 years, the total Government expenditure amounted to $3.080 trillion which is almost 4 times the nominal GDP in 2018. From 1993 – 2014 total Government expenditure amounted to $1.912 trillion, which gave rise to an average of $476 billion spent over a five years period, while in 2015-2019, total Government expenditure amounted $1.160 trillion, which is almost 2 and ½ times the average expenditure for a five-year period under the previous administration. In other words, the level of Government spending under the current administration is 2 ½ times greater than that of its predecessor.
Total Government expenditure is divided into two main categories – that is, capital expenditure and current expenditure. Current expenditure or government final consumption expenditure include goods and services for current use to directly satisfy individual or collective needs of the members of the community; (2) capital expenditure of fixed capital expenditure (or government investment) include government spending on goods and services intended to create future benefits, such as infrastructure investment in transport (roads, rail, airports), health (water collection and distribution, sewage systems, information communications technology, and research spending).
To these ends, allocation towards current expenditure for the period 1993-2014 averaged at 70 per cent of total expenditure and the remaining 30 per cent being allocated towards capital expenditure. Further, during this period, current expenditure reached a high of 74 per cent on two occasions: 1993 and 2002, while its lowest was 59 per cent in 2007 and remained within the region of 60 – 74 per cent of total government expenditure. This means more than 30 per cent and close to 40 per cent in some instances of total government expenditure were allocated towards capital projects which are investments that create future benefit, and which help to stimulate economic development.
On the other hand, during the period 2015-2019, average allocation towards current expenditure amounted to 78 per cent of total expenditure with the lowest being 75 per cent in 2017 and the highest of 82 per cent in 2015, thus, leaving a meagre 22 per cent of the total budget, on average for capital projects.
Next week, the author shall examine the deeper economic implications of these trends in Government spending and the relationship with economic development.
Discover more from Guyana Times
Subscribe to get the latest posts sent to your email.